Public Transport Recovery Deep Dive (NYC, San Francisco, Chicago)
- Ridership collapsed in all three metros in April 2020, to about 11% to 20% of pre-COVID seasonal baseline.
- By 2025, New York recovered the most (86.7% of 2019 annual volume), Chicago is mid-recovery (70.0%), and San Francisco lags (58.9%).
- Bus recovered better than rail in each metro, strongest in San Francisco (bus share change +10.9 pp vs 2019).
- Recovery appears structurally uneven, with persistent weakness in commuter-oriented rail demand.
Data, Source, and Methodology
- Data nature: Monthly Unlinked Passenger Trips (UPT) from NTD; counts boardings rather than unique riders.
- Source: U.S. DOT / FTA NTD Monthly Modal Time Series: dataset link.
- Coverage: January 2014 through December 2025.
- Metro definitions: New York (MTA NYCT rail + bus), San Francisco (BART rail + Muni rail + bus), Chicago (CTA rail + bus).
- Baseline: Same-calendar-month average over 2014-2019.
- Main metric: Index = monthly UPT / baseline UPT for same month × 100.
Interpretation note: this is a descriptive trend analysis, not a causal model.
Insight 1: Recovery paths diverged after a common COVID shock
Interpretation: All three metros experienced extreme initial collapse, but long-run recovery paths separated substantially by city.
| Metro | Trough (Apr 2020 index) | First 50% (3MMA) | First 75% (3MMA) | 2025 Avg Index |
|---|---|---|---|---|
| New York | 12.2 | 2021-07 | 2023-03 | 86.7 |
| Chicago | 19.9 | 2022-07 | Not reached | 65.2 |
| San Francisco | 11.3 | 2022-11 | Not reached | 57.9 |
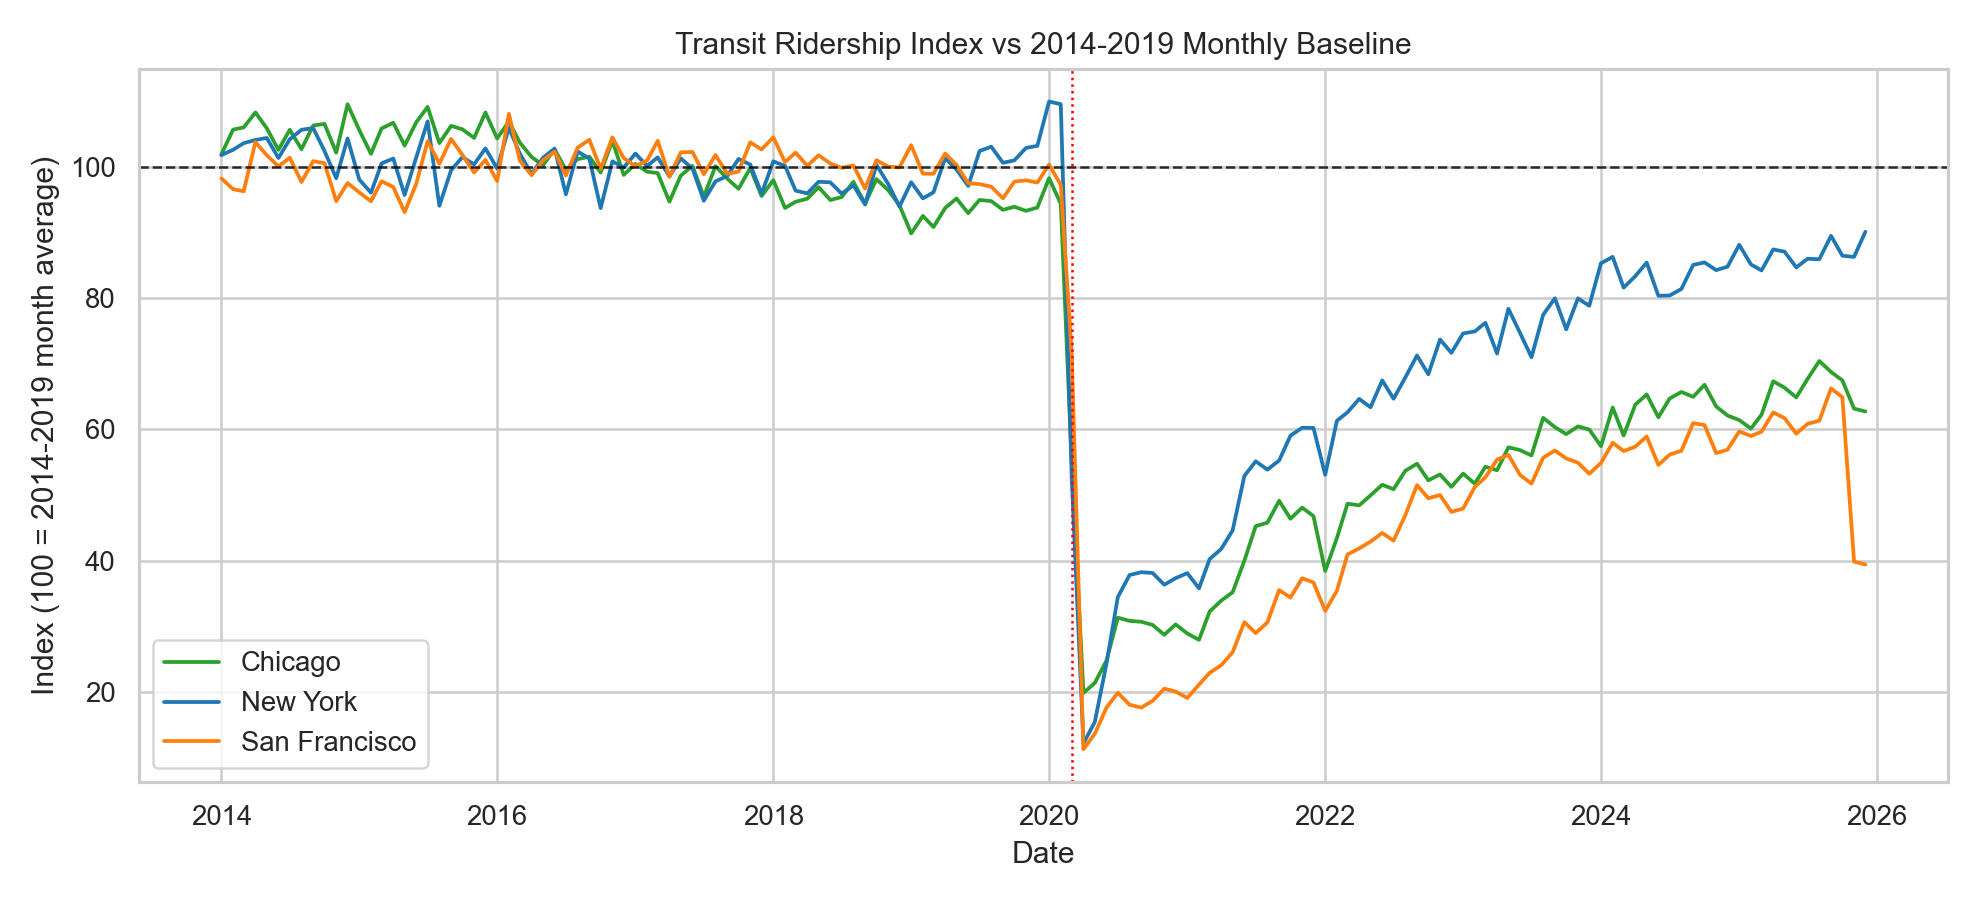
Figure 1. Baseline-normalized ridership index by metro (100 = 2014-2019 same-month average).
Insight 2: Absolute volumes remain below pre-COVID scale
Interpretation: Percentage recovery improved, but absolute monthly and annual rider volumes remain materially lower than 2019 in every city.
| Metro | 2019 Annual UPT | 2025 Annual UPT | 2025 vs 2019 |
|---|---|---|---|
| New York | ~3.49B | ~3.03B | 86.7% |
| Chicago | ~395M | ~277M | 70.0% |
| San Francisco | ~182M | ~107M | 58.9% |
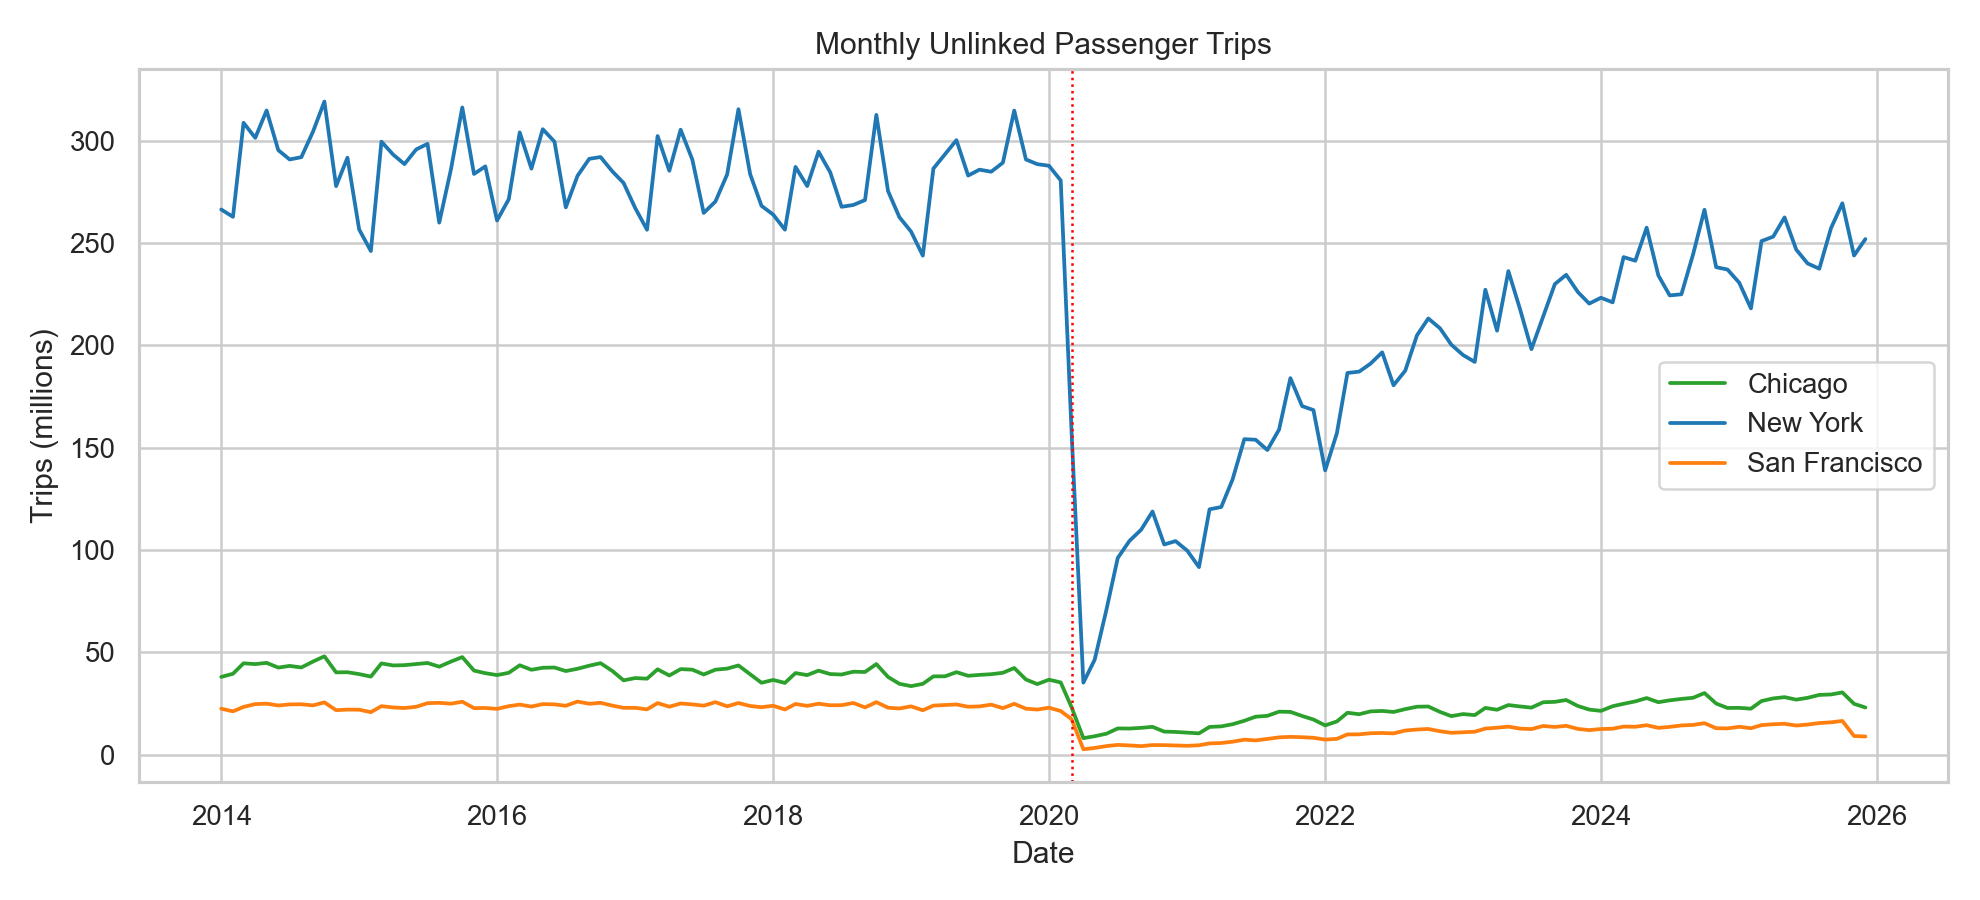
Figure 2. Monthly unlinked passenger trips (millions).
Insight 3: Bus outperformed rail in post-COVID recovery
Interpretation: Rail-heavy, commute-oriented patterns recovered more slowly than bus usage, especially in San Francisco and Chicago.
| Metro | Bus Index (2025 Avg) | Rail Index (2025 Avg) |
|---|---|---|
| New York | 89.8 | 85.9 |
| Chicago | 71.7 | 58.0 |
| San Francisco | 77.7 | 46.3 |
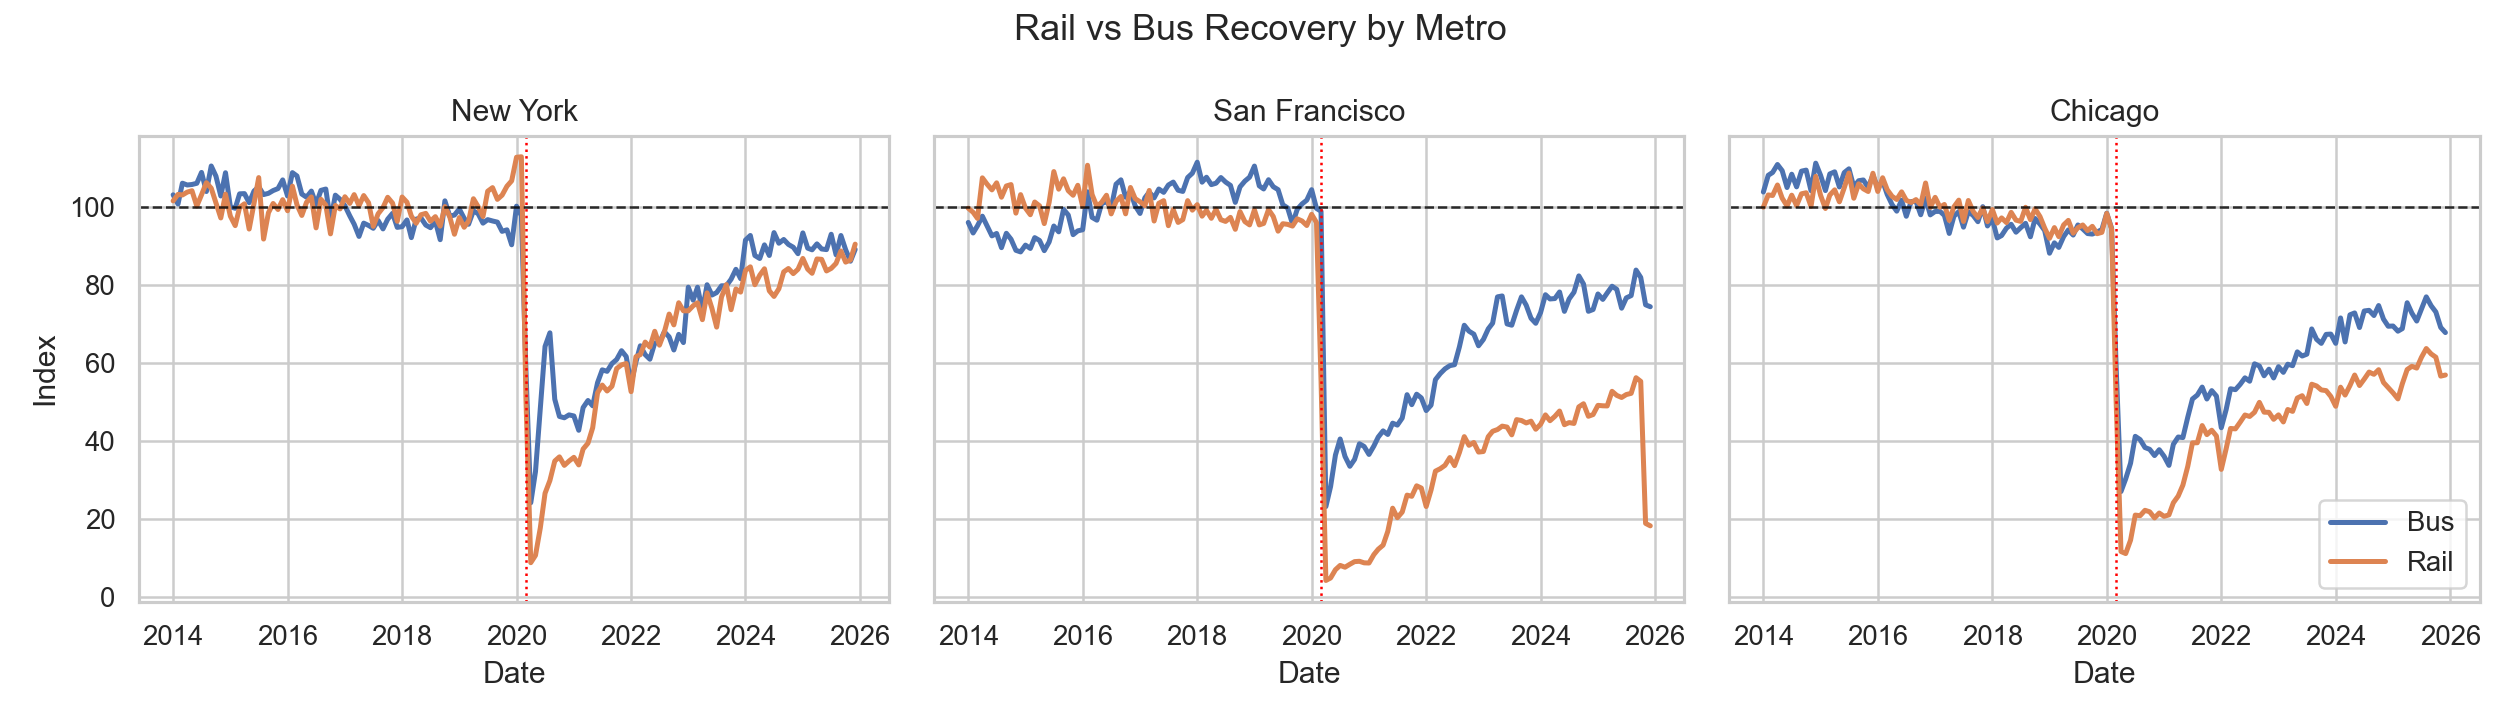
Figure 3. Rail and bus baseline-normalized recovery paths by metro.
Insight 4: Mode share shifted toward bus
Interpretation: In all three metros, bus gained share relative to rail versus 2019, implying lasting demand rebalancing.
| Metro | Bus Share (2019) | Bus Share (2025) | Change (pp) |
|---|---|---|---|
| New York | 20.1% | 21.8% | +1.7 |
| Chicago | 52.3% | 57.6% | +5.3 |
| San Francisco | 38.2% | 49.1% | +10.9 |
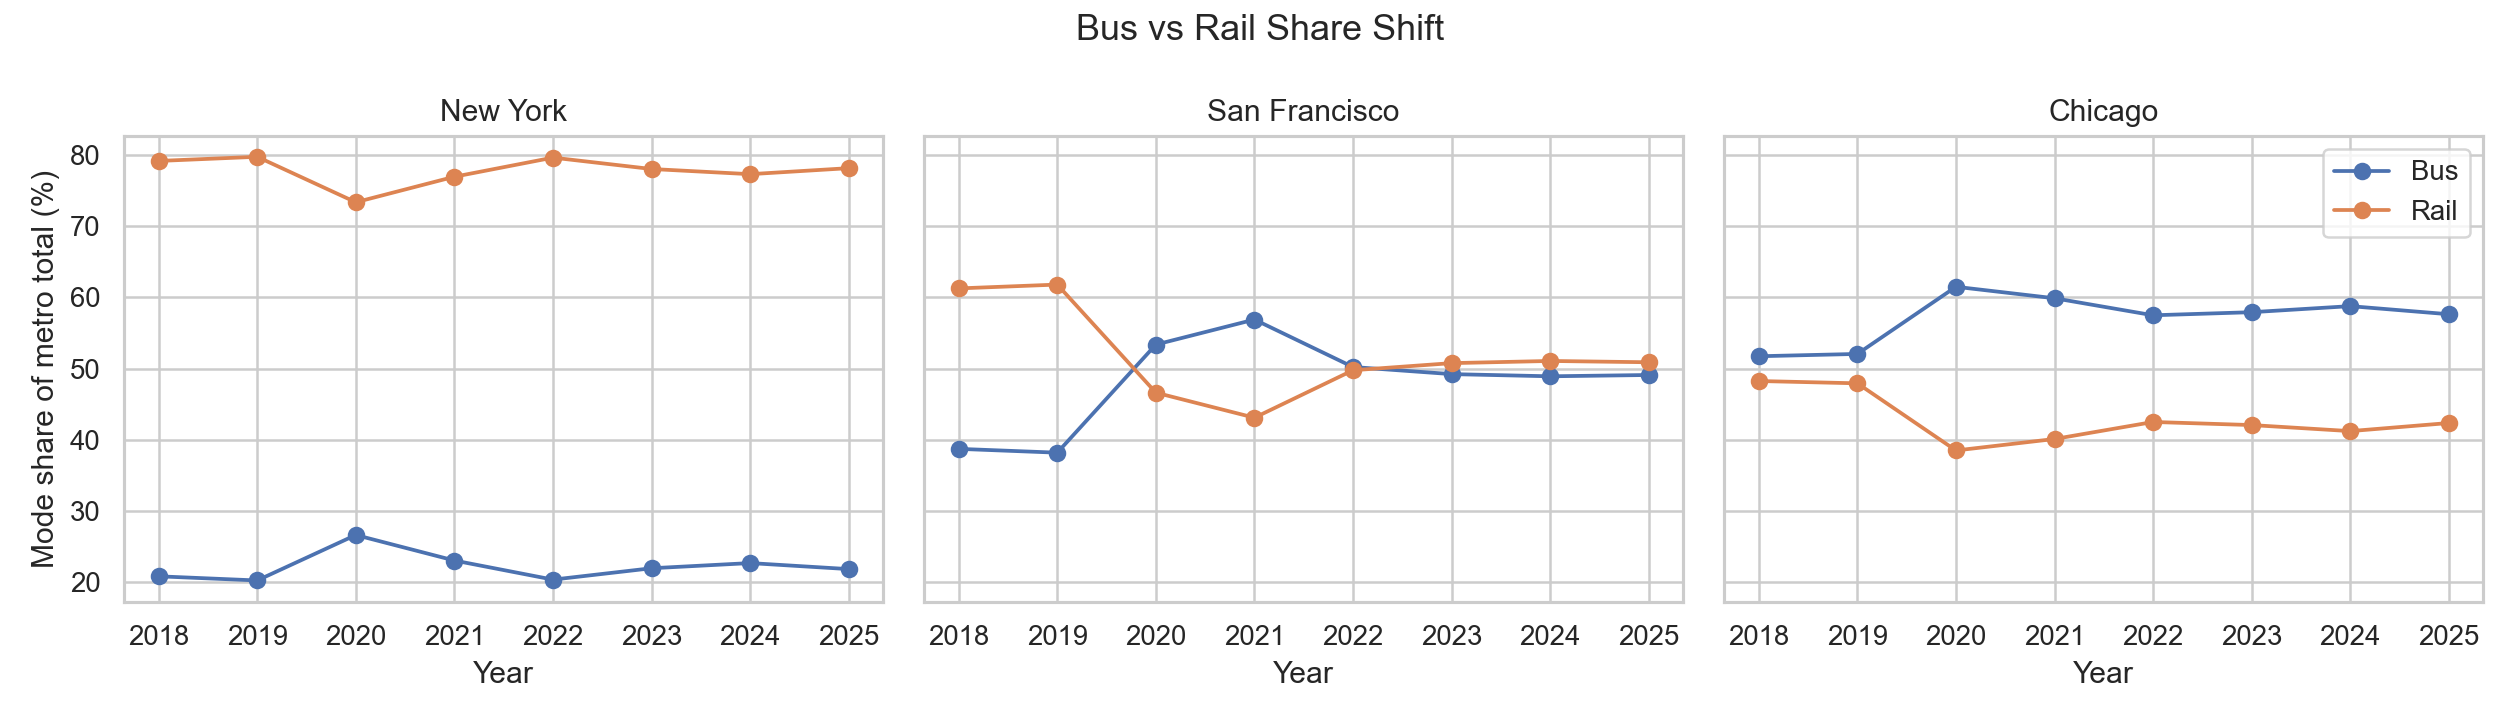
Figure 4. Bus vs rail share shift from pre-COVID through 2025.
Detailed Findings
- All three metros reached their minimum index in April 2020.
- New York is the only city in this set to reach a sustained 75 index recovery threshold by 2025.
- San Francisco remains the furthest from baseline, mainly due to rail underperformance.
- Chicago has moderate system-level recovery but clear rail weakness relative to bus.
Caveats
- UPT counts boardings, so transfer behavior affects totals.
- Metro aggregation choices prioritize comparability and may not match every local system report scope.
- Findings are descriptive trends and should not be read as causal attribution.